After completing my competitive learning application, I was eager to see quite what Javascript was actually capable of. At the same time, I knew vaguely what fractals were - but never much more - and I was keen to learn a little more about them. This post summarizes what a fractal is (specifically relating to the Mandelbrot set), and then describes my fractal explorer web application, which you can have a play with right here.
Introduction
Google defines a fractal as:
A curve or geometric figure, each part of which has the same statistical character as the whole.
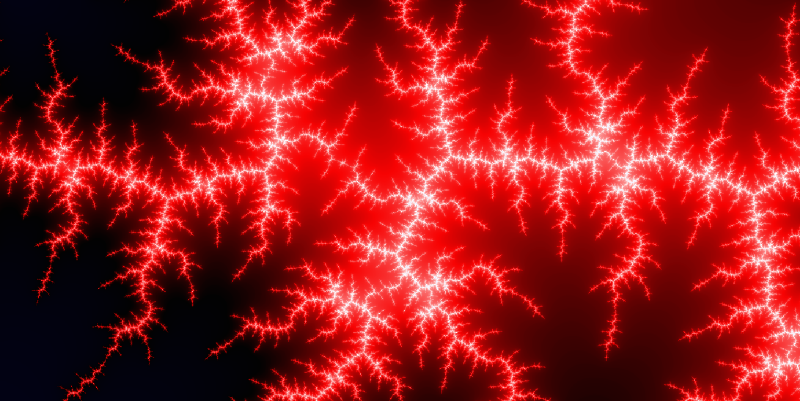
So, a fractal is typically formed by applying some iterative algorithm to an initial (often mathematically generated) state, and displaying the results graphically somehow. As a result, it is typical that similar patterns can be seen across different parts of the image, and often across different magnifications.
One of the most famous fractals is created by visualising the Mandelbrot Set. The mandelbrot set is generated by iteratively applying the simple looking equation z = z2 + c, where both z and c are complex numbers. Complex numbers are numbers that are made out of two parts - a real and an imaginary part - for example 4 + 5i. The maths used to work with imaginary numbers is not too complex, and is based around the fact that i2 = -1, or conversely, the square root of -1 is i. A quick google will bring up some great tutorials on imaginary numbers for more information.
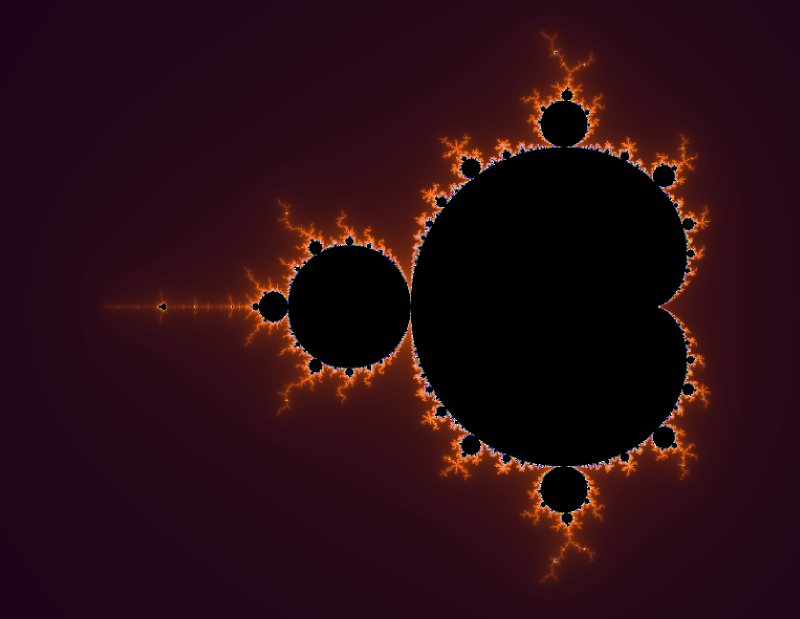
Visualizing the Mandelbrot set
To visualise the Mandelbrot set, we map the complex number c onto a grid of pixels, whereby the real part of c corresponds to the x coordinate, and the imaginary part corresponds to the y coordinate (for example, 0.2+0.5i would correspond to the coordinates [0.2,0.5]). Next, we iteratively apply the equation z = z2 + c for every set of coordinates c pertaining to a pixel we wish to colour in. z is set initially to 0+0i.
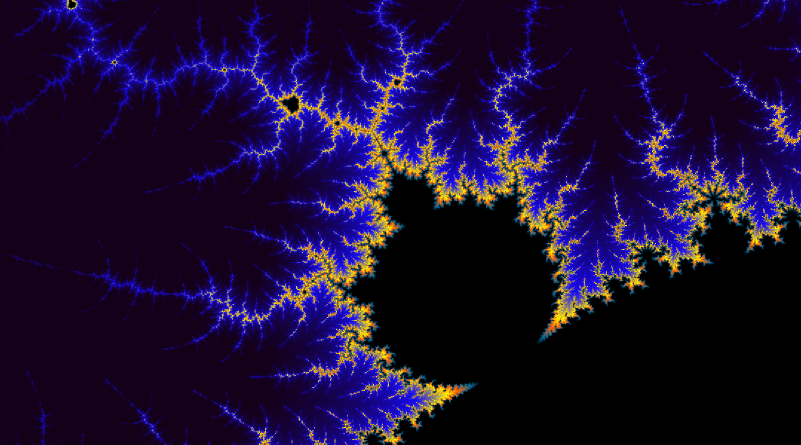
Treating the output z as a set of coordinates too, we count the number of iterations taken for z to become further than a (Euclidean) distance of 2 away from the origin (0,0). That is, if you draw a circle around the origin (0,0) with a radius of 2, we stop counting the number of iterations once the value of z leaves this circle. If z does not leave the circle after some pre-set maximum number of iterations (for example, 400), we stop iterating, and set the number of iterations to whatever this maximum value is. Next, we select a colour based on the number of iterations counted. For example, if the maximum number of iterations allowed is 400, we could colour pixels such that the greater the number of iterations taken to leave the circle, the darker a given point becomes.
One thing worth noting here is that colouring by counting iterations leads to discrete bands of colour in the fractal. To combat this myself, I pulled in an equation I found lying in a forum somewhere, but I can't claim to know exactly how it works or remember specifically where from!
The exact code I used to calculate the value for each pixel was the following (where capital letters are in place of variables references elsewhere):
function mandelbrotGeneral(x, y, c1, c2) {
	var x2 = x * x, y2 = y * y;
	var i = 0;
	while(i < MAX_ITERATIONS && x2+y2 < ER_SQUARED) {
		y = 2 * x * y + c2;
		x = x2 - y2 + c1;
		y2 = y * y;
		x2 = x * x;
		i++;
	}

	//this bit just smooths the colour value out:
	if(NO_SMOOTHING == true) {
		return i;
	} else {
		var p = mathLog(Math.abs(x2+y2),2)/mathLog(ER_SQUARED,2);
		var frac = mathLog(p);
		if(isNaN(frac)) return i;
		else return i - frac;
	}
}

function mandelbrot(args) {
	return mandelbrotGeneral(C1, C2, args[0], args[1]);
}

function julia(args) {
	return mandelbrotGeneral(args[0], args[1], C1, C2);
}
The top part of mandelbrotGeneral carries out the formula z = z2 + c iteratively, where x and y are in fact the real and imaginary parts of c, and c1 and c2 are the real and imaginary parts of z. The iteration stops once the value exceeds ER_SQUARED, which is just the square of the escape radius (4 is a sensible value for this), and the number of iterations taken is smoothed (if NO_SMOOTHING is true) and returned. The functions mandelbrot and julia both take in an array of x and y coordinates, and pass these in place of either the z or c values to mandelbrotGeneral. So, by passing in the coordinates corresponding to each pixel we want to colour in, we get back a value between 0 and whatever MAX_ITERATIONS is set too, and can map this value to a colour.
The smoothing part of the function uses a slightly modified version of Math.log, which can optionally take in a base as its second argument. The function is shown below:
function mathLog(val, base) {
	if(typeof base == "undefined") {
		return Math.log(val);
	} else {
		return Math.log(val)/Math.log(base);
	}
}
One of the fun things about fractals is the ability to endlessly zoom in to them. If you understood the last paragraph, it may now be quite obvious how this is done. Essentially, to draw the Mandelbrot fractal (among others) in the first place, you must map coordinates on a grid between say, (-2,-1) to (2,1) onto a 2 dimensional array of pixels. to Zoom in then, we simply change this mapping such that a smaller range of coordinates is mapped onto the same array of pixels. We can repeat this process to zoom in as far as possible, restricted only by the precision of the numbers used.
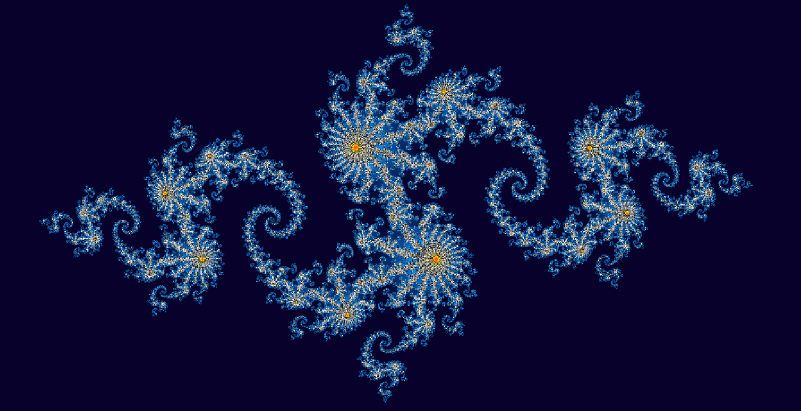
The Julia set
The Julia set is closely related to the Mandelbrot set. Essentially, the same equation is used, except that instead of using the complex number c as the coordinates of pixels to colour, we set the starting value of z to the coordinates of each pixel. Now, the value of c can be changed to produce various fractal patterns (which involves setting two constants actually; the real and imaginary part of c). This can be seen in the above code; the same equation is used, but the arguments are simply swapped around. The rest works the same, whereby we iteratively apply the formula with the previous value of z, until the value given lies outside a radius of 2 from (0,0), and then colour pixels based on the number of iterations taken to do this.
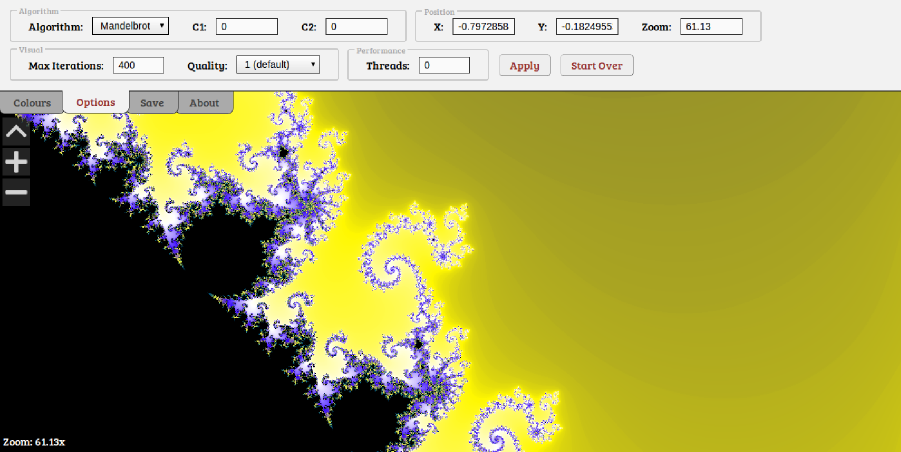
My Fractal Explorer
So, after having learned the above, I set about creating the fractal explorer which you can see here. Some of the features of my Fractal Explorer application are as follows:
- Ability to explore both Mandelbrot and Julia set fractals.
- Ability to modify the value of z (for the Mandelbrot set) or c (for the Julia set).
- Zooming and panning as much as the precision of Javascript floats allows.
- Multiple threads supported using Web Workers.
- Fractals can be rendered at different quality levels (essentially a form of anti-aliasing).
- Fractal images can be generated and saved at custom resolutions and aspect ratios.
- Complete control over the colours used in rendering fractals (colour picker code written by David Durman).
- Ability to change the maximum iteration count, for increased detail in some areas.
- Ability to save and shorten the saved link to get back to your fractal or share it with others.
Fractals are rendered over 2 passes using alternate lines so that you can see what you're looking at sooner and zoom or pan before it completes. Web workers essentially split the image into segments and apply this process to each segment instead, if you have the number of threads set to more than 0 in the dropdown options. Tests reveal multiple threads to be significantly faster, notably at higher quality settings, however there is some overhead in transmitting the relevant data back and forth between threads which can lead to worse performance in some cases (for example on single core machines or using only one thread).
Colours are assigned by taking the smoothed number of iterations taken for each pixel's coordinates to exceed the radius, and mapping that to a user defined gradient which is constructed from a series of colours at some set points, and a smooth transition from one colour to the next between these points. As a result, changing the colour scheme of the fractal is computationally easy compared to recalculating the fractal itself.
The available quality settings are created by essentially sampling the square of that quality value's number of regions within each pixel, and averaging out the values. So, for a quality of 1, the value is calculated for only the centre-point of each pixel, and so in reality, the colour is based on what is in the centre of that pixel only. A quality level of 3 on the other hand splits each pixel into a 3 by 3 grid of sub-regions, and calculates the value for the centre-points of all of these, averaging out the result (and making it 9 times slower). This leads to significantly smoother transitions between pixels, as the resulting value is more representative of the pixel as a whole.
Finally, saving images works by essentially running the fractal generator on a hidden canvas of the desired size and with the relevant settings (position, zoom etc), and then outputting the result of that canvas as an on screen image. I found this less likely to lead to memory issues than providing a direct download link, although large images will still be problematic. To shorten links (which are read in as the page is loaded to calibrate the settings accordingly), I simply make a call to Google's link shortening service and output the result.
So, I think that about sums that up. Have a play with it here if you haven't already. If you have any questions or comments, please feel free to leave them below, and I'll get back to you when I can!